Fourier's Theorem and the Spectrum of Complex Tones
In the last section we distinguished between sounds and musical tones. We further subdivided musical tones into pure tones--consisting of single frequency sine waves--and complex tones. In this section we are going to examine the frequencies that make up the complex tone. As we will see there is a mathematical method of breaking a signal in the time domain into all of its individual frequency components. The mathematical technique is called aFourier Transform, and the act of examining a time signal broken down into its individual frequency components is calledspectral analysis or harmonic analysis.
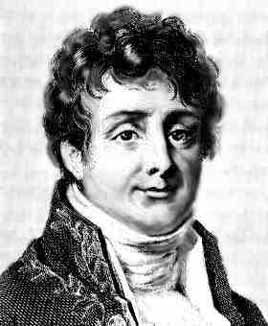
The mathematics of breaking a signal down into its individual frequency components was pioneered by (surprise, surprise) Joseph Fourier whose pretty picture is given below. Click on the image to learn more about the interesting life of J. F. who almost lost his head in the French Revolution and who was later one of Napoleon's home boys.

The detailed mathematics of the Fourier transform is complicated and beyond our needs; however, theprincipleon which the Fourier transform is based is relatively straightforward to state and (with a bit of work) to understand. The basic concept of spectral analysis of complex tones is contained in Fourier's Theorem which states:
Any periodic signal is composed of a superposition of pure sine waves, with suitably chosen amplitudes and phases, whose frequencies are harmonics of the fundamental frequency of the signal.
Although that seems like quite a mouthful let's analyze it piece by piece. First, you know what aperiodic signalis--a signal that exhibits a pattern that repeats with a regular time interval, such as the harmonica note we examined in the last section. We also saw how to find thefundamental frequency of the periodic signalby measuring the time for the pattern to repeat (the period) and inverting that number to get a frequency in Hertz. This number is the fundamental frequency of the signal. There can be no lower frequencies in the signal because a lower frequency would add differently from one period to the next and make the signal non-periodic. This last point takes a bit of thought. Ask if it's still troubling you.
Now you know whatpure sine waveslook like. Theamplitudeis the size of the wave measured from the midpoint to one maximum (remember the amplitude goes positive and negative as measured from the mid-point).Phasehas no meaning for a sine wave on its own, however, for two (or more) sine waves phase is a measure of the offset in time between the waves. If the waves are the same frequency and they reach a maximum at the same time they are said to be in phase. If one wave is at a minimum when the other is at a maximum the waves are said to be completely out-of-phase or 180 degrees out of phase. In between these extremes the phase is measured in degrees as a measure of how far apart in time the two waves are.
The wordsuperpositionjust means that we add the amplitudes of two or more sine waves at a given time to get the total amplitude of the signal at that time.
Finally, the wordharmonicmeans that the frequency is an integer (1,2,3,4...) multiple of the fundamental frequency.
These points are best illustrated by a simple example. In this example I build up a complex tone by adding two pure sine waves.

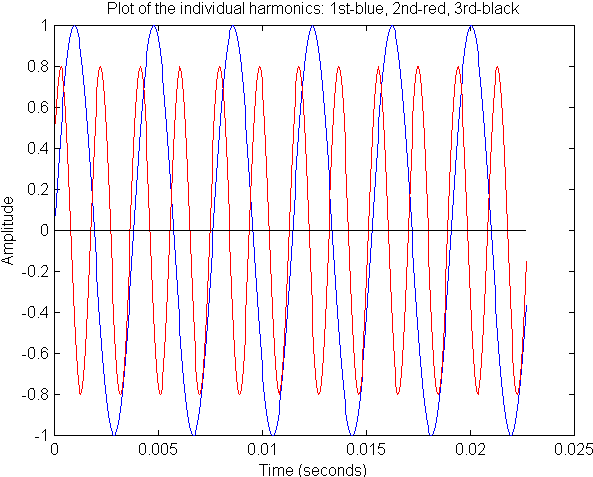
The blue curve is a pure sine wave of frequency 262 Hz and the red curve is the second harmonic of 262, that is 2 x 262 = 524 Hz. You could have calculated these frequencies from the graph even if I had not given them to you. How would you do that? The amplitude of the blue curve is 1 and the amplitude of the red curve is 0.8. I made the two curves out of phase by about 30 degrees. Note that at time t = 0 s the blue curve is at 0 whereas the red curve is at about 0.5 on the vertical axis. If the two waves were in phase they would both start at 0 at t = 0 s.
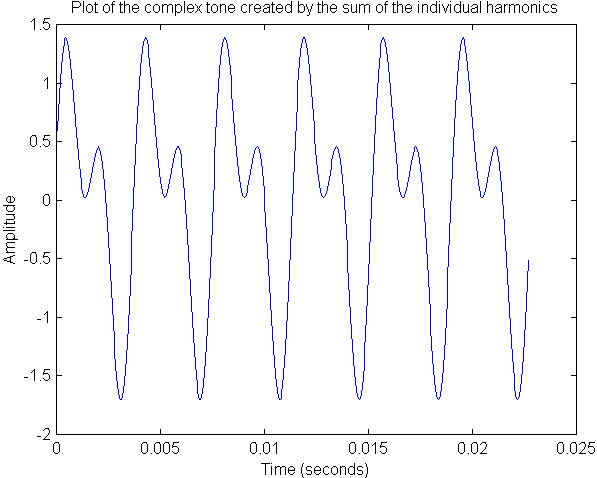
Now the act of superposition means that I add the amplitudes of the two curves at each point in time. Performing this operation results in the following waveform.

Compare the last two graphs to convince yourself that the addition looks correct; for example, look at time t = 0 in Figure 1 and note that the blue curve is at 0 and the red curve is at 0.6--added together give 0.6 at time t = 0 on figure 2.
By adding the two pure sine waves we have created a complex tone! Note that the period of the complex tone--the repeat time of the pattern in Figure 2--is the same as the repeat time of the lower frequency pure sine wave (blue curve in Figure 1). Thus, the 262 Hz sine wave is the fundamental frequency of the complex tone. Note that although we can use Figure 2 to find out the fundamental frequency we cannot easily get any information about the second (or any higher) harmonics that might be in the complex tone just by examining this graph alone. The Fourier transform is able to give us this information. We'll examine that subject in the next section but first it is instructive to listen to the two pure tones and to the complex tone that results from their addition.
262 Hz Pure Tone (.wav)
524 Hz Pure Tone (.wav)
Complex Tone (.wav)
First note that the pure tones sound a little mechanical whereas the complex tone sounds a bit more like what we would associate with a note from a musical instrument. In fact, there are few, if any, musical instruments that produce pure tones. All musical instruments based on plucked strings or resonance in tubes produce notes that are complex tones.
Second, listen to the complex tone and decide which of the two pure tones has the same "pitch". You should pick the lower frequency (262 Hz) tone. This result is general, we associate the frequency of the fundamental as the pitch of the complex tone. We'll come back to this observation later in class.
Self test
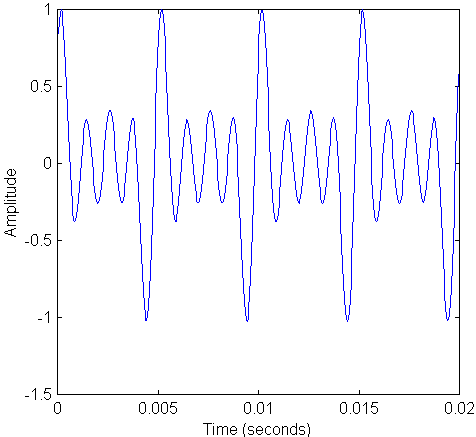
Examine the following complex tone waveform.

- What is the frequency of the fundamental of this tone?
Listen to the above tone:
Send me an email at wroberts@mtsu.edu
Contact Information
Dr. W. M. Robertson
MTSU Box X-116
Murfreesboro, TN 37132
Ph. (615) 898-5837


