Pre-lab #11 Hubble's Law
Cosmic Expansion
Now let’s turn our attention to the large-scale motions of galaxies and galaxy clusters. Within a galaxy cluster, individual galaxies move more or less randomly. You might expect that, on even larger scales, the clusters themselves would also have random, disordered motion—some clusters moving this way, some that. In fact, this is not the case. On the largest scales, galaxies and galaxy clusters alike move in a very ordered way.
Universal Recession
|
|
|
Figure 16.1 Galaxy Spectra Optical spectra, shown at left, of several galaxies named on the right. Both the extent of the redshift (denoted by the horizontal yellow arrows) and the distance from the Milky Way Galaxy to each galaxy (numbers in center column) increase from top to bottom. The vertical yellow arrow in the top spectrum highlights a particular spectral feature (a pair of dark absorption lines). The horizontal yellow arrows indicate how this feature shifts to longer wavelengths in spectra of more distant galaxies. The lines at top and bottom of each spectrum are laboratory references. (Palomar/Caltech) |
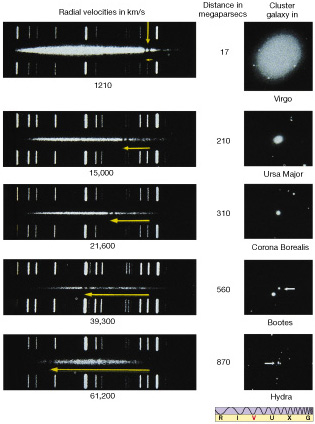
In 1912 the American astronomer Vesto M. Slipher, working under the direction of Percival Lowell, discovered that virtually every spiral galaxy he observed had a redshifted spectrum—it was receding from our Galaxy. In fact, with the exception of a few nearby systems, every known galaxy is part of a general motion away from us in all directions. Individual galaxies that are not part of galaxy clusters are steadily receding. Galaxy clusters too have an overall recessional motion, although their individual member galaxies move randomly with respect to one another. (Consider a jar full of fireflies that has been thrown into the air. The fireflies within the jar, like the galaxies within the cluster, have random motions due to their individual whims, but the jar as a whole, like the galaxy cluster, has some directed motion as well.)
Figure 16.1 shows the optical spectra of several galaxies, arranged in order of increasing distance from the Milky Way Galaxy. These spectra are redshifted, indicating that the galaxies are receding. Furthermore, the extent of the redshift increases progressively from top to bottom in the figure. There is a connection between Doppler shift and distance: the greater the distance, the greater the redshift. This trend holds for nearly all galaxies in the universe. (Two galaxies within our Local Group, including Andromeda, and a few galaxies in the Virgo Cluster display blueshifts and so are moving toward us, but this results from their local motions within their parent clusters. Recall the fireflies in the jar.)
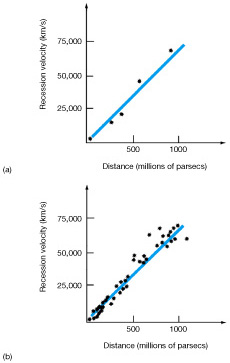
Figure 16.2(a) shows recessional velocity plotted against distance for the galaxies of Figure 16.1. Figure 16.2(b) is a similar plot for some more galaxies within about one billion parsecs of Earth. Plots like these were first made by Edwin Hubble in the 1920s and now bear his name—Hubble diagrams. The data points generally fall close to a straight line, indicating that the rate at which a galaxy recedes is directly proportional to its distance from us. This rule is called Hubble’s law. We could construct such a diagram for any group of galaxies, provided we could determine their distances and velocities. The universal recession described by the Hubble diagram is sometimes called the Hubble flow.
|
|
|
Figure 16.2 Hubble’s Law Plots of recessional velocity against distance (a) for the galaxies shown in Figure 16.1 and (b) for numerous other galaxies within about one billion pc of Earth. |
The recessional motions of the galaxies prove that the cosmos is not steady and unchanging on the largest scales. The universe (actually, space itself ) is expanding. However, let’s be clear on just what is expanding and what is not. Hubble’s law does not mean that humans, Earth, the solar system, or even individual galaxies and galaxy clusters are physically increasing in size. These groups of atoms, rocks, planets, stars, and galaxies are held together by their own internal forces and are not themselves getting bigger. Only the largest framework of the universe—the distances separating the galaxy clusters and superclusters—is expanding.
To distinguish recessional redshift from redshifts caused by motion within an object—for example, galaxy orbits within a cluster or explosive events in a galactic nucleus—the redshift resulting from the Hubble flow is called the cosmological redshift. Objects that lie so far away that they exhibit a large cosmological redshift are said to be at cosmological distances—distances comparable to the scale of the universe itself.
Hubble’s law has some fairly dramatic implications. If nearly all galaxies show recessional velocity according to Hubble’s law, then doesn’t that mean that they all started their journey from a single point? If we could run time backward, wouldn’t all the galaxies fly back to this one point, perhaps the site of some explosion in the remote past? The answer is yes—but not in the way you might expect! We will explore the ramifications of the Hubble flow for the past and future evolution of our universe. For now, however, we set aside its cosmic implications and use Hubble’s law simply as a convenient distance-measuring tool.
Hubble’s Constant
The constant of proportionality between recessional velocity and distance in Hubble’s law is known as Hubble’s constant, denoted by the symbol H0. The data shown in Figure 16.2 then obey the equation:
Recessional velocity = H0 x distance
The value of Hubble’s constant is the slope of the straight line—recessional velocity divided by distance—in Figure 16.2(b). Reading the numbers off the graph, this comes to roughly 70,000 km/s divided by 1000 Mpc, or 70 km/s/Mpc (kilometers per second per megaparsec, the most commonly used unit for H0). Astronomers continually strive to refine the accuracy of the Hubble diagram and the resulting estimate of H0 because Hubble’s constant is one of the most fundamental quantities of nature—it specifies the rate of expansion of the entire cosmos.
The precise value of Hubble’s constant is the subject of considerable debate. The most recent measurements, made by many different research groups, using different sets of galaxies and a wide variety of distance-measurement techniques, give results mainly between 50 and 80 km/s/Mpc. For now, astronomers must simply live with this uncertainty. We will adopt H0 = 70km/s/Mpc (roughly in the middle of all recent results) as the best current estimate of Hubble’s constant for the remainder of the text. Bear in mind, though, that there is considerable ambiguity—and dispute—among experts as to the true value of this very important number.

