Pre-lab 8: Spectroscopy
The Electromagnetic Spectrum
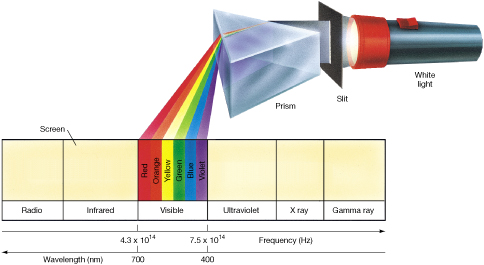
White light is a mixture of colors, which we conventionally divide into six major hues—red, orange, yellow, green, blue, and violet. As shown in Figure 2.7, we can separate a beam of white light into a rainbow of these basic colors—called a spectrum (plural: spectra)—by passing it through a prism. This experiment was first reported by Isaac Newton more than 300 years ago. In principle, the original beam of white light could be recovered by passing the spectrum through a second prism to recombine the colored beams.
|
Figure 2.7 Visible Spectrum When passed through a prism, white light splits into its component colors, spanning red to violet in the visible part of the electromagnetic spectrum. The slit narrows the beam of radiation. The image on the screen is just a series of different-colored images of the slit. Human eyes are insensitive to radiation of wavelength shorter than 400 nm or longer than 700 nm. |
The Components of Visible Light
What determines the color of a beam of light? The answer is its frequency (or, equivalently, its wavelength)—we see different colors because our eyes react differently to electromagnetic waves of different frequencies. Red light has a frequency of roughly 4.3 x 10¹⁴ Hz corresponding to a wavelength of about 7.0 x 10⁻⁷ m. Violet light, at the other end of the visible range, has nearly double the frequency—7.5 x 10¹⁴ Hz —and (since the speed of light is the same in either case) just over half the wavelength—4.0 x 10⁻⁷ m. The other colors we see have frequencies and wavelengths intermediate between these two extremes.
Scientists often use a unit called the nanometer (nm) when describing the wavelength of light (see Appendix 2). There are 109 nanometers in one meter. An older unit called the angstrom (1 Å = 10-10 m = 0.1 nm) is also widely used by many astronomers and atomic physicists, although the nanometer is now preferred. Thus, the visible spectrum covers the wavelength range from 400 to 700 nm (4000 to 7000 Å). The radiation to which our eyes are most sensitive has a wavelength near the middle of this range, at about 550 nm (5500 Å), in the yellow-green region of the spectrum.
The Full Range of Radiation
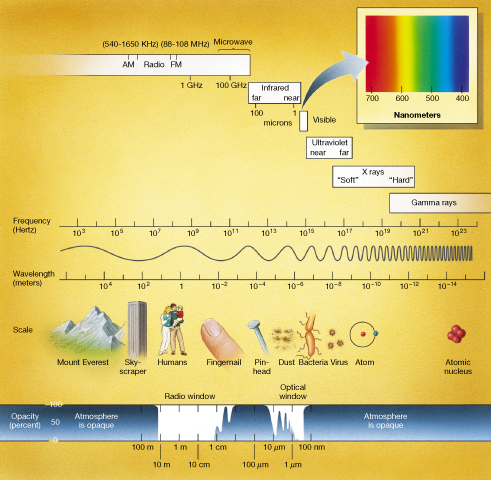
Figure 2.8 plots the entire range of electromagnetic radiation. Radio and infrared radiation lies to the low-frequency, long-wavelength side of visible light. Radio frequencies include radar, microwave radiation, and the familiar AM, FM, and TV bands. We perceive infrared radiation as heat. The ultraviolet, X-ray, and gamma-ray radiation lies to the high-frequency, short-wavelength side of visible light. Ultraviolet radiation, lying just beyond the violet end of the visible spectrum, is responsible for suntans and sunburns. X-rays are perhaps best known for their ability to penetrate human tissue and reveal the state of our insides without our resorting to surgery. Gamma rays are the shortest-wavelength radiation. They are often associated with radioactivity and are invariably damaging to any living cells they encounter.
All these spectral regions, including the visible, collectively make up the electromagnetic spectrum. Remember that despite their greatly differing wavelengths and the very different roles they play in everyday life on Earth, all types of electromagnetic radiation are basically the same and all move at the same speed—the speed of light c.
Figure 2.8 is worth studying carefully, as it contains a great deal of information. Note that wave frequency (in hertz) increases from left to right, and wavelength (in meters) increases from right to left. Notice that the wavelength and frequency scales in Figure 2.8 do not increase by equal increments of 10. Instead, successive values marked on the horizontal axis differ by factors of 10—each successive value is 10 times greater than its neighbor. This type of scale (called a logarithmic scale) is often used in science in order to condense a very large range of some quantity into a manageable size. Throughout the text we will often find it convenient to use such a scale in order to compress a wide range of some quantity onto a single easy-to-view plot.
Figure 2.8 shows wavelengths extending from the height of mountains for radio radiation to the diameter of an atomic nucleus for gamma-ray radiation. The box at the upper right emphasizes how small the visible portion of the electromagnetic spectrum is. Most objects in the universe emit large amounts of invisible radiation. Indeed, many objects emit only a tiny fraction of their total energy in the visible range. A wealth of extra knowledge can be gained by studying the invisible regions of the electromagnetic spectrum.


